
1 Introduction
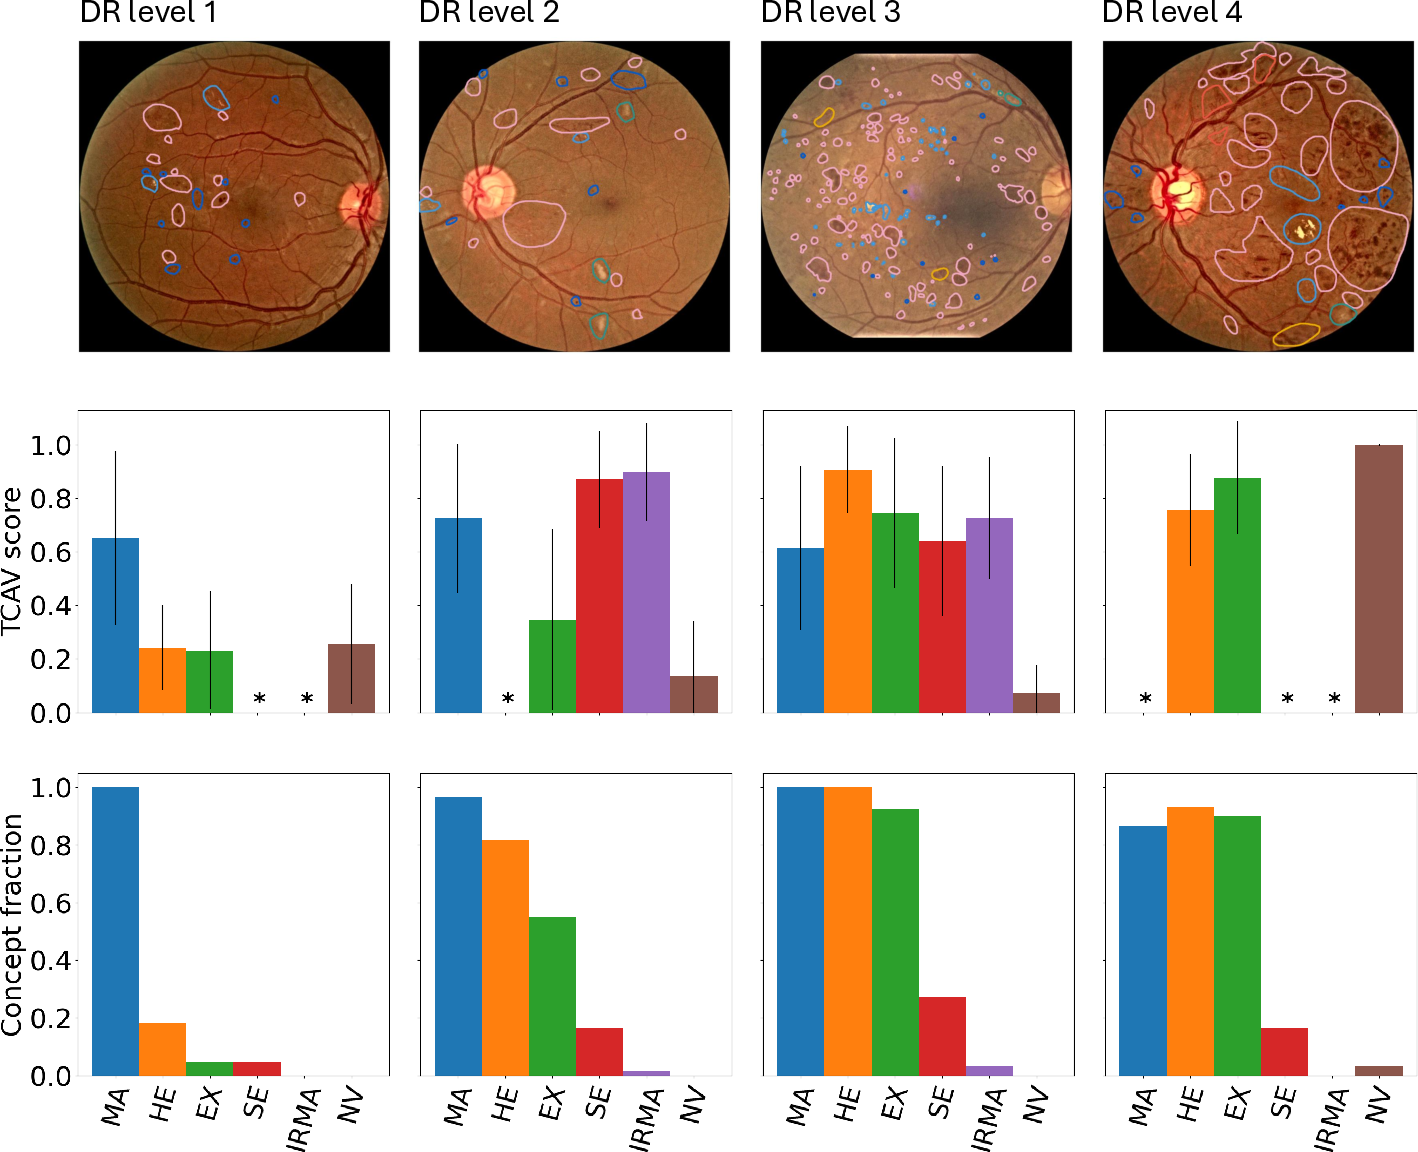
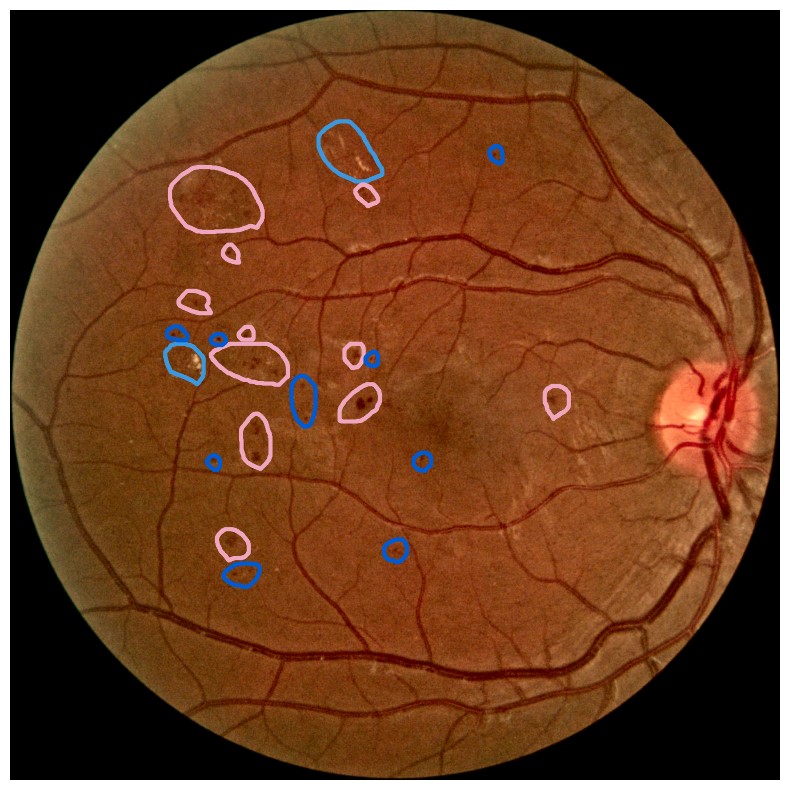
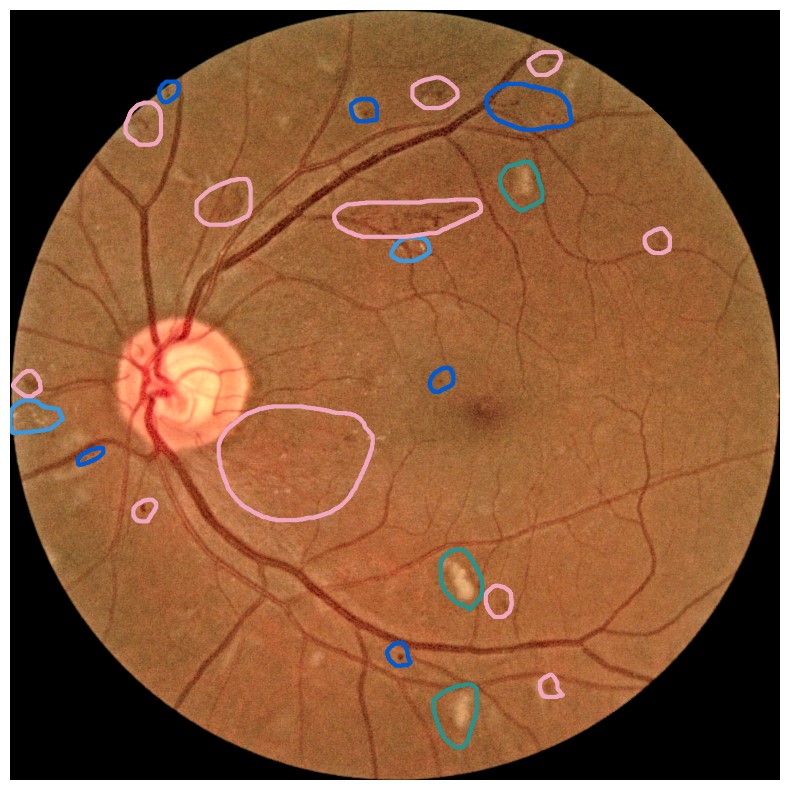
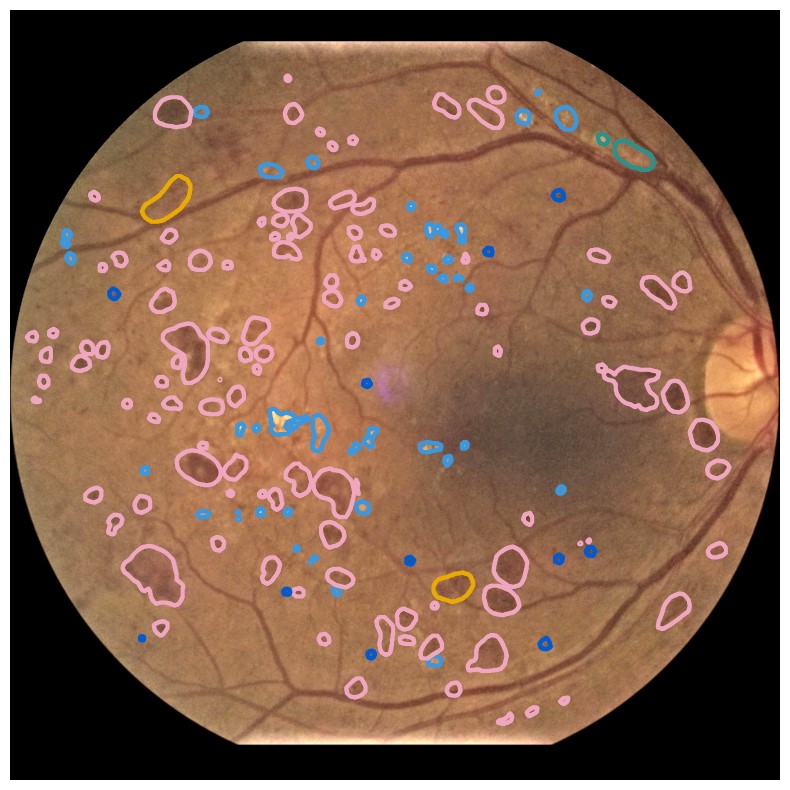
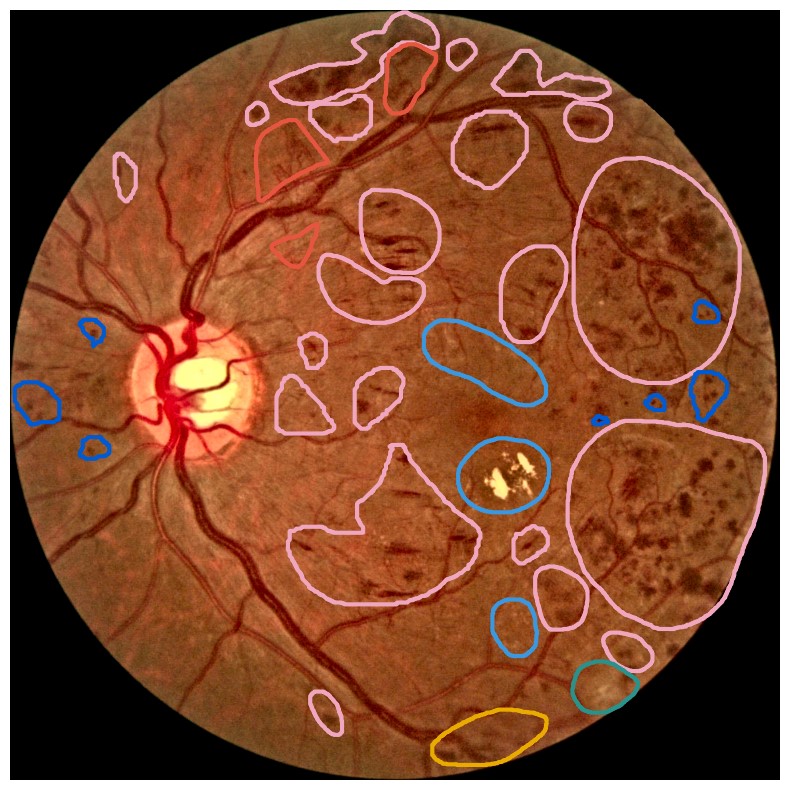
Diabetes is a disease with increasing prevalence, and diabetic retinopathy (DR) is one of the most common complications (World Health Organization, 2022). DR is characterized by retinal abnormalities, which damage the eye and can lead to blindness. Its severity depends on the type and amount of retinal abnormalities: HE, microaneurysms (MA), hard exudates (EX), soft exudates (SE), intraretinal microvascular abnormalities (IRMA), and neovascularization (NV). DR is graded from to (no DR, mild, moderate, and severe nonproliferative DR, and proliferative DR), as described by Wilkinson et al. (2003). DR grading of fundus images is traditionally a manual process requiring medical expertise. Figure 1 provides examples of fundus images of eyes with increasing severity of DR including the ground truth segmentations of the six retinal abnormalities. These images underline the challenge of identifying relevant medical abnormalities without specialist training.
Deep neural networks have shown impressive results for objectively predicting levels of DR from fundus images (Lakshminarayanan et al., 2021). However, these models are complex and difficult to interpret, which is regarded as an obstacle for clinical implementation of such systems (Vellido, 2020). If ophthalmologists do not understand why the model made the specific predictions, they might refuse to use it. Moreover, if algorithms make decisions that can affect the life of the patient to a large extent, such as in medical diagnoses, the patient has the right to get an explanation about why the decision was made. In other words, being able to explain the decision process of deep neural networks for medical applications is crucial.

XAI aims to explain machine learning models and their predictions. Previous work on explainable artificial intelligence (XAI) for fundus image analysis have mainly focused on heatmap methods, which highlight the pixels in the image regarded as important during inference (van der Velden et al., 2022). As an example, Ayhan et al. (2022) performed a quantitative analysis of heatmaps produced by a wide selection of XAI methods to explain deep learning-based DR detection in fundus images, showing that the quality of heatmaps vary greatly. Despite their popularity, heatmap methods have some limitations (Arun et al., 2021). Heatmaps do not explain why an area in the image was highlighted (Kovalerchuk et al., 2021), or quantify how important the highlighted area is. Moreover, one heatmap is generated for each observation, making it challenging to get a global overview of how the model interprets images.
Concept explanation methods are attractive for medical applications because they measure how much the deep neural networks are influenced by high-level concepts representing clinical findings (Salahuddin et al., 2022). A concept can be described as a theme or topic, e.g., ’stripes’ and ’dots’ for natural images, or diagnostic findings such as ’hemorrhages’ and ’microaneurysms’ for fundus images. The six different diagnostic concepts used for this work is shown with the ground truth segmentation masks in Figure 1. TCAV (Kim et al., 2018) and Concept Bottleneck Models (Koh et al., 2020) are two concept-based methods that have several advantages above heatmap methods. Both allow the user to define the concepts, which ensures relevant and meaningful concepts that are interpretable for the end-users. How the concepts are used varies between the two explanation methods and is outlined in Sections 2.1 and 2.2. Moreover, the relative importance of the concepts can be quantitatively measured. For Testing with Concept Activation Vectors (TCAV), concept scores can be generated for a group of images, e.g. images belonging to the same class, allowing the user to investigate whether the model has learnt aspects coherent to domain knowledge and diagnostic guidelines. CBMs, on the other hand, allow the user to directly modify the model’s intermediate concept predictions at test time and observe how this affects the final model prediction. This way of manipulating the model after training is attractive in the medical field, e.g. if the clinician wants to increase the emphasis of a concept in the image that the model missed. While TCAV explains models post-hoc, i.e., predicting the concepts after the classification model has been trained, CBMs provide ad-hoc explanations, where the prediction of the concepts are trained together with the classification model. Even though concept explanations can be more intuitive than heatmaps for medical doctors, neither TCAV or CBMs have been extensively studied in the field of DR grading. In this work, we thus investigate and compare TCAV and CBMs for explaining deep neural networks trained to grade DR in fundus images.
2 Data and Method
Seven open access datasets were used in the current study: APTOS (Karthik and Dane, 2019), DR Detection (Dugas et al., 2015; Cuadros and Bresnick, 2009), Messidor-2 (Decencière et al., 2014; Abràmoff et al., 2013), FGADR (Zhou et al., 2021), DDR (Li et al., 2019), DIARETDB1 (Kauppi et al., 2007) and IDRiD (Porwal et al., 2018). An overview of the data is provided in Table 1. All datasets including image-level annotations of DR grade were used to train the deep neural networks for DR grading. Several data sources are combined to ensure generalizable models, as the fundus images were captured at different locations, by different healthcare personnel, and using different devices, making the training data diverse. For concept generation, fundus images segmented with medical findings relevant for diagnosis of DR were used. FGADR was applied for both DR grading and concept generation. The distribution of DR levels are highly skewed, with the majority of the images representing eyes with no signs of DR, and annotations of IRMA and NV are only available in FGADR. The four datasets used for developing the DR grading models were split into for training, for validation, and testing. Images from the same patient were placed in the same split of the dataset. Additionally, the black background was removed from all images. Further on, Contrast Limited Adapted Histogram Equalization (CLAHE) was applied to enhance the image quality by making the blood vessels and retinal findings more visible (Zuiderveld, 1994). For the training set, several image augmentation techniques, such as random flipping, blurring, and change of perspective, were also applied. The source code for all the experiments, including concept explanations, is publicly available online111https://github.com/AndreaStoraas/ConceptExplanations_DR_grading.
| Datasets with DR grading | Total | Level 0 | Level 1 | Level 2 | Level 3 | Level 4 |
|---|---|---|---|---|---|---|
| APTOS | ||||||
| DR Detection | ||||||
| Messidor-2 | ||||||
| FGADR | ||||||
| Datasets with segmentations | Total | MA | HE | SE | EX | IRMA/NV |
| FGADR | / | |||||
| DDR | NA | |||||
| DIARETDB1 | NA | |||||
| IDRiD | NA |
2.1 Testing with Concept Activation Vectors
Two model architectures, Inception V3 (Szegedy et al., 2016) and Densenet-121 (Huang et al., 2017), were applied due to good performance on analyzing fundus images in previous work (Kora et al., 2022; Tsangalidou et al., 2022; Zhou et al., 2021). Both models were pretrained on ImageNet (Deng et al., 2009), as also used in the previous works, and modified to predict five classes in the final prediction layer. The models were fine-tuned for epochs on the combined training and validation sets for DR grading. The best performing model on the validation set was used for further evaluation. Due to class imbalance, a weighted random sampler was used during training. Moreover, an Adam optimizer with default hyperparameters and cross-entropy loss were applied (Paszke et al., 2019).
TCAV measures the relative concept importance for a classification result by checking how sensitive the model is to changes in the input image toward the direction of the concept, defined by the concept’s corresponding concept activation vector (CAV) (Kim et al., 2018). For estimating the CAV, the user provides a set of positive example images containing the concept of interest and a set of negative example images, where the concept is absent. Next, features are extracted from the positive and negative example sets, respectively, from a specific layer in the model chosen by the user. A linear classifier is trained to separate the features from the two image sets apart, and the resulting CAV lies orthogonal to the classification boundary of the linear model. The process is repeated for each concept. For more details about the mathematics behind the XAI method, the interested reader is referred to the original TCAV paper (Kim et al., 2018). In our work, the concepts were defined as described in the original publication (Kim et al., 2018). First, the full images were used to represent the concepts (Kim et al., 2018), as opposed to cropping out the image regions where the specific medical finding for a given concept were located. However, abnormalities in fundus images can be small, and are typically not evenly distributed in the image. We therefore tested a second way of preprocessing the concept images, masking out the area around the relevant medical findings based on the segmentation masks. This might enhance the quality of the concepts and was inspired by Chen et al. (2020). To avoid extreme variations in image sizes, the masked images were restricted to be at least pixels. For both concept generation approaches, CLAHE was applied to enhance the quality of the concept images.
Regardless of the image preprocessing approach, concepts were generated for all six medical findings used for grading DR in fundus images (MA, hemorrhages (HE), EX, SE, IRMA, and NV) based on the segmentation masks. Positive examples containing the concept and negative examples without the concept were employed for generating the concept activation vectors. The presence of other findings in the images were balanced between the positive and negative examples. The positive and negative example sets contained images each, which were randomly selected from the four datasets. To test the significance of the detected concepts, different negative sets were generated for each concept. FGADR was the only dataset annotated with IRMA and NV, and all positive and negative examples for these two concepts thus arrived from the FGADR dataset.
Next, TCAV scores were calculated for images from the test set. The concepts were extracted from Denseblock4, which is the last block before the prediction layer of the Densenet-121 model. To make sure the concepts were consistent and not only caused by randomness, two-sided paired t-tests were performed on the TCAV scores for a given DR level using the positive example set for a given concept and the negative example sets. Only statistically significant concepts with p-values were considered.
2.2 Concept Bottleneck Models
CBMs differ from TCAV in that the concepts are learnt together with the target labels during model training. The deep neural network is modified to include a bottleneck layer that predicts the concepts before the final prediction layer (Koh et al., 2020). In other words, the final labels are predicted directly from the concepts. By inspecting the probabilities for the predicted concepts for a given input image, it is possible to observe how much each concept influences the model. A drawback of CBMs is that the dataset must include annotations for both the target labels and the concepts of interest for all images in the dataset. Consequently, getting enough annotated data could be an issue, especially in the medical field, where annotations are typically challenging and expensive to obtain. Moreover, only concepts included during the training phase can be explored. For TCAV, this is less of a concern because the concepts are defined after training the model and the example images are not restricted to images from the training dataset.
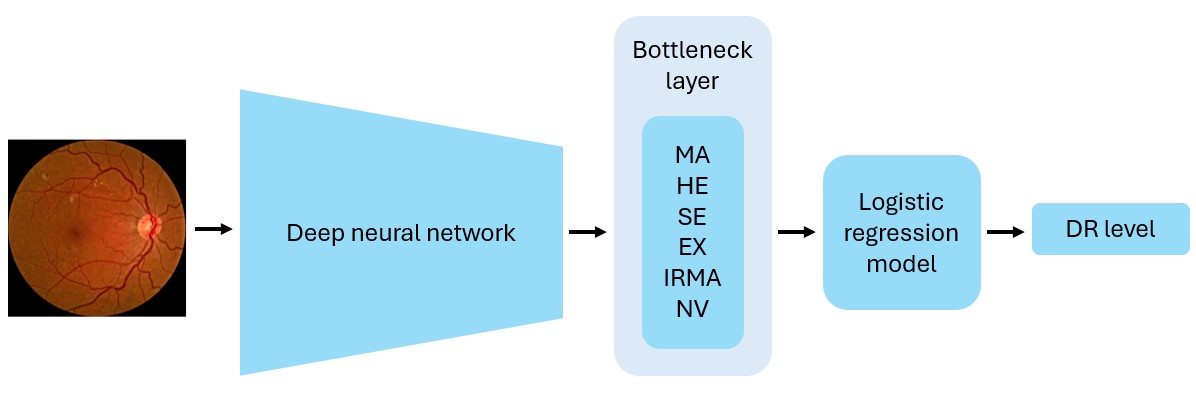
Because CBMs learn the concepts during model training, the deep neural network used for TCAV could not be used. The original CBM paper (Koh et al., 2020) describes several alternative ways of designing CBMs. In our experiments, we implemented sequential bottleneck models using a modified version of the Densenet-121 and Inception V3 architectures, as shown in Figure 2. The bottleneck model was initiated with the weights from the corresponding DR grading model and fine-tuned to predict the presence of six diagnostic concepts. Next, we trained a logistic regression (LR) model to classify DR levels from the concept predictions provided by the bottleneck model. The FGADR dataset, being the only dataset annotated with both DR levels and all six concepts, was applied for training. Due to limited amount of training data, another bottleneck model was also trained to only predict the four most prevalent concepts: MA, HE, EX, and SE. By excluding the IRMA and NV concepts, the DDR, IDRiD, and DIARETDB1 datasets can also be used for training. Images of DR level 0 without any of the concepts were also included in the training, validation and test sets, encouraging the models to not always predict the most prevalent concepts to be present. Following Koh et al. (2020), binary cross entropy with logits loss was used for training the bottleneck models. Apart from that, the bottleneck and LR models were trained with the same hyperparameters as the DR grading models.
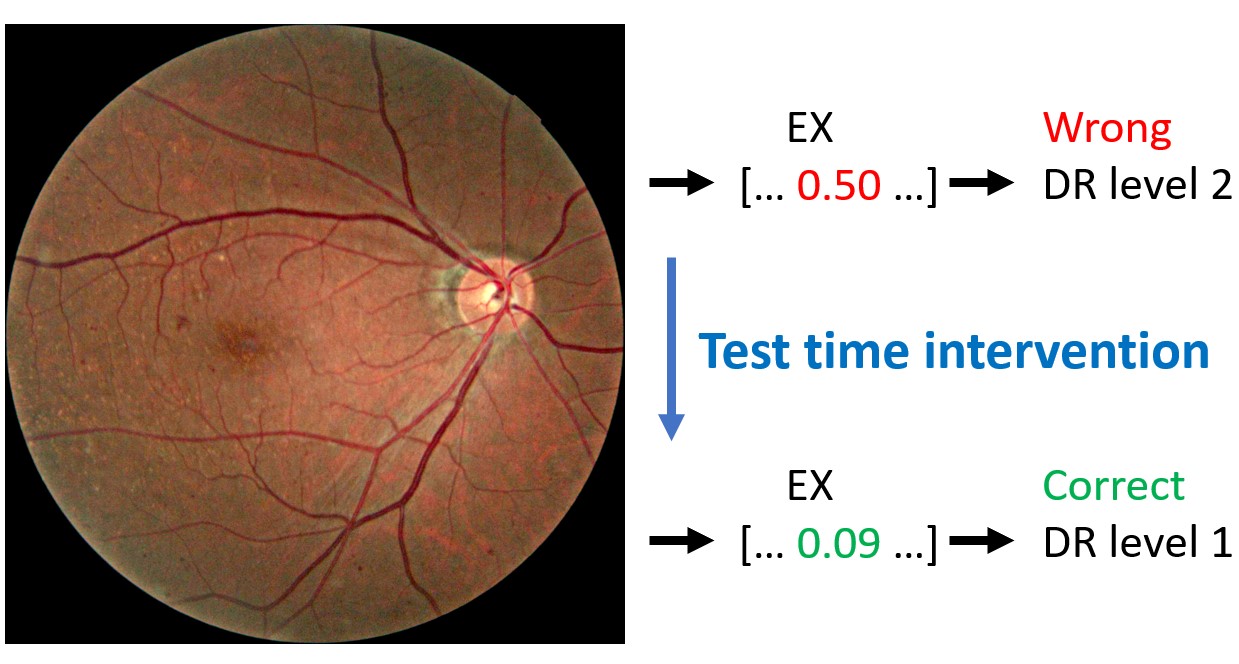
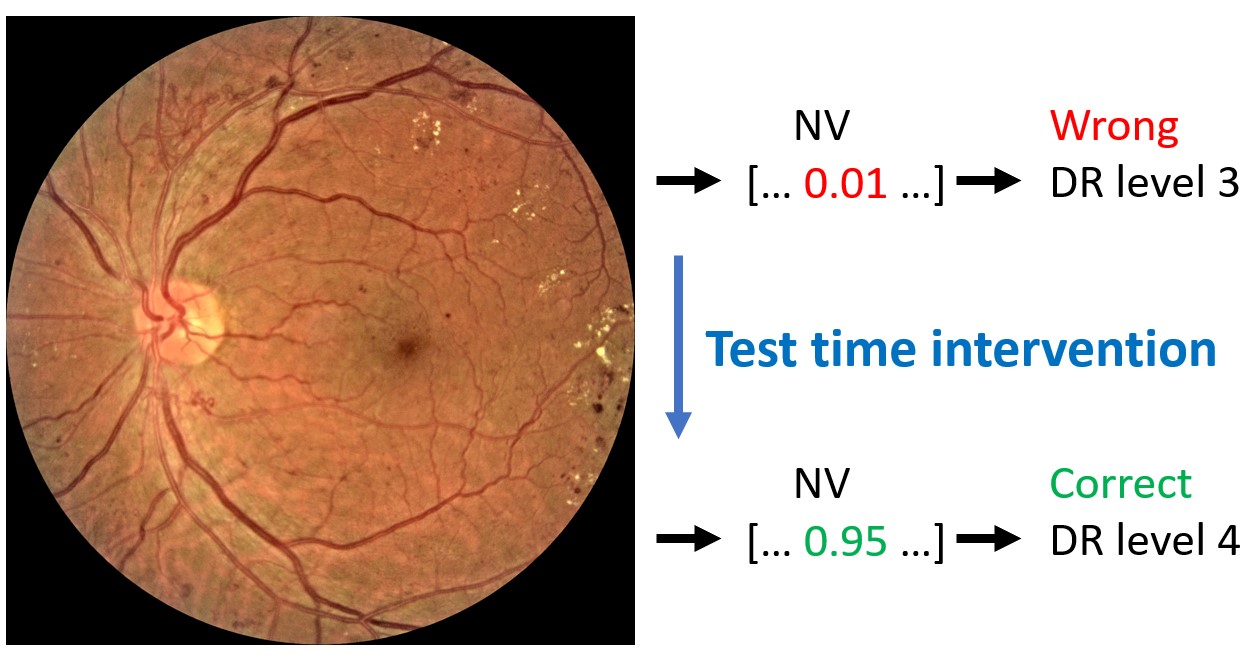
The main advantage with CBMs is the possibility of manually correcting the predicted concepts provided to the LR model at test time. Inspired by the original paper (Koh et al., 2020), we intervened on the concepts by using the 1st and 99th percentiles for the predicted concept values on the training dataset. These percentiles functioned as surrogates for the true concept values for the absence and presence of a given concepts, respectively. Test time intervention was performed on the entire FGADR test set. Additionally, the intervention was performed on the subset of test images classified with incorrect DR levels to make it easier to observe the differences in model performance with and without test time intervention. In both cases, only incorrect concept predictions were corrected using the percentile values. The effect of incrementally correcting more concepts was studied, where the concepts were ordered based on the increase in balanced accuracy when adjusting the concepts independently.
3 Results
The models based on the Densenet-121 architecture outperformed the Inception V3-based models for both TCAV and CBMs models. The performance metrics on DR grading for the models based on Densenet-121 on the combined and FGADR test sets are presented in Table 2. Because concepts were not used when training the models explained by TCAV, the performance metrics reported for the ‘TCAV models’ can be regarded as baseline results for DR level classification. We observe from Table 2 that the model used for TCAV had the highest performance on the combined test set. The CBM trained on six concepts generalized poorly from FGADR to the combined test set, but performed best on the FGADR test set. This is not surprising, as the FGADR training set is much smaller and less diverse than the combined training set. For the model trained on four concepts, the performance was not significantly different between the two test sets because of the mixed training data. Regarding the concept detection task, the CBM trained on six concepts correctly identified 86.2% of the diagnostic concepts, compared to 82.5% for the model based on four concepts. The balanced accuracy also increased from 80.9% to 85.9% when increasing the number of concepts. These results were computed on the FGADR test set. The CBM trained on six concepts was used in further experiments since this model performed best on the FGADR data for both DR grading and concept detection.
| Model |
| Acc. |
| F1 score | MCC | Precision | ||||
|---|---|---|---|---|---|---|---|---|---|---|
| Combined test set | ||||||||||
| TCAV | - | 81.2% | 62.3% | 0.612 | 0.615 | 0.613 | ||||
| CBM | ||||||||||
| CBM | ||||||||||
| FGADR test set | ||||||||||
| TCAV | - | 66.7% | 0.547 | |||||||
| CBM | ||||||||||
| CBM | ||||||||||
| CBM + TTI (full) | 0.412 | |||||||||
| CBM + TTI (incorrect) | 69.4% | 0.634 | 0.628 |
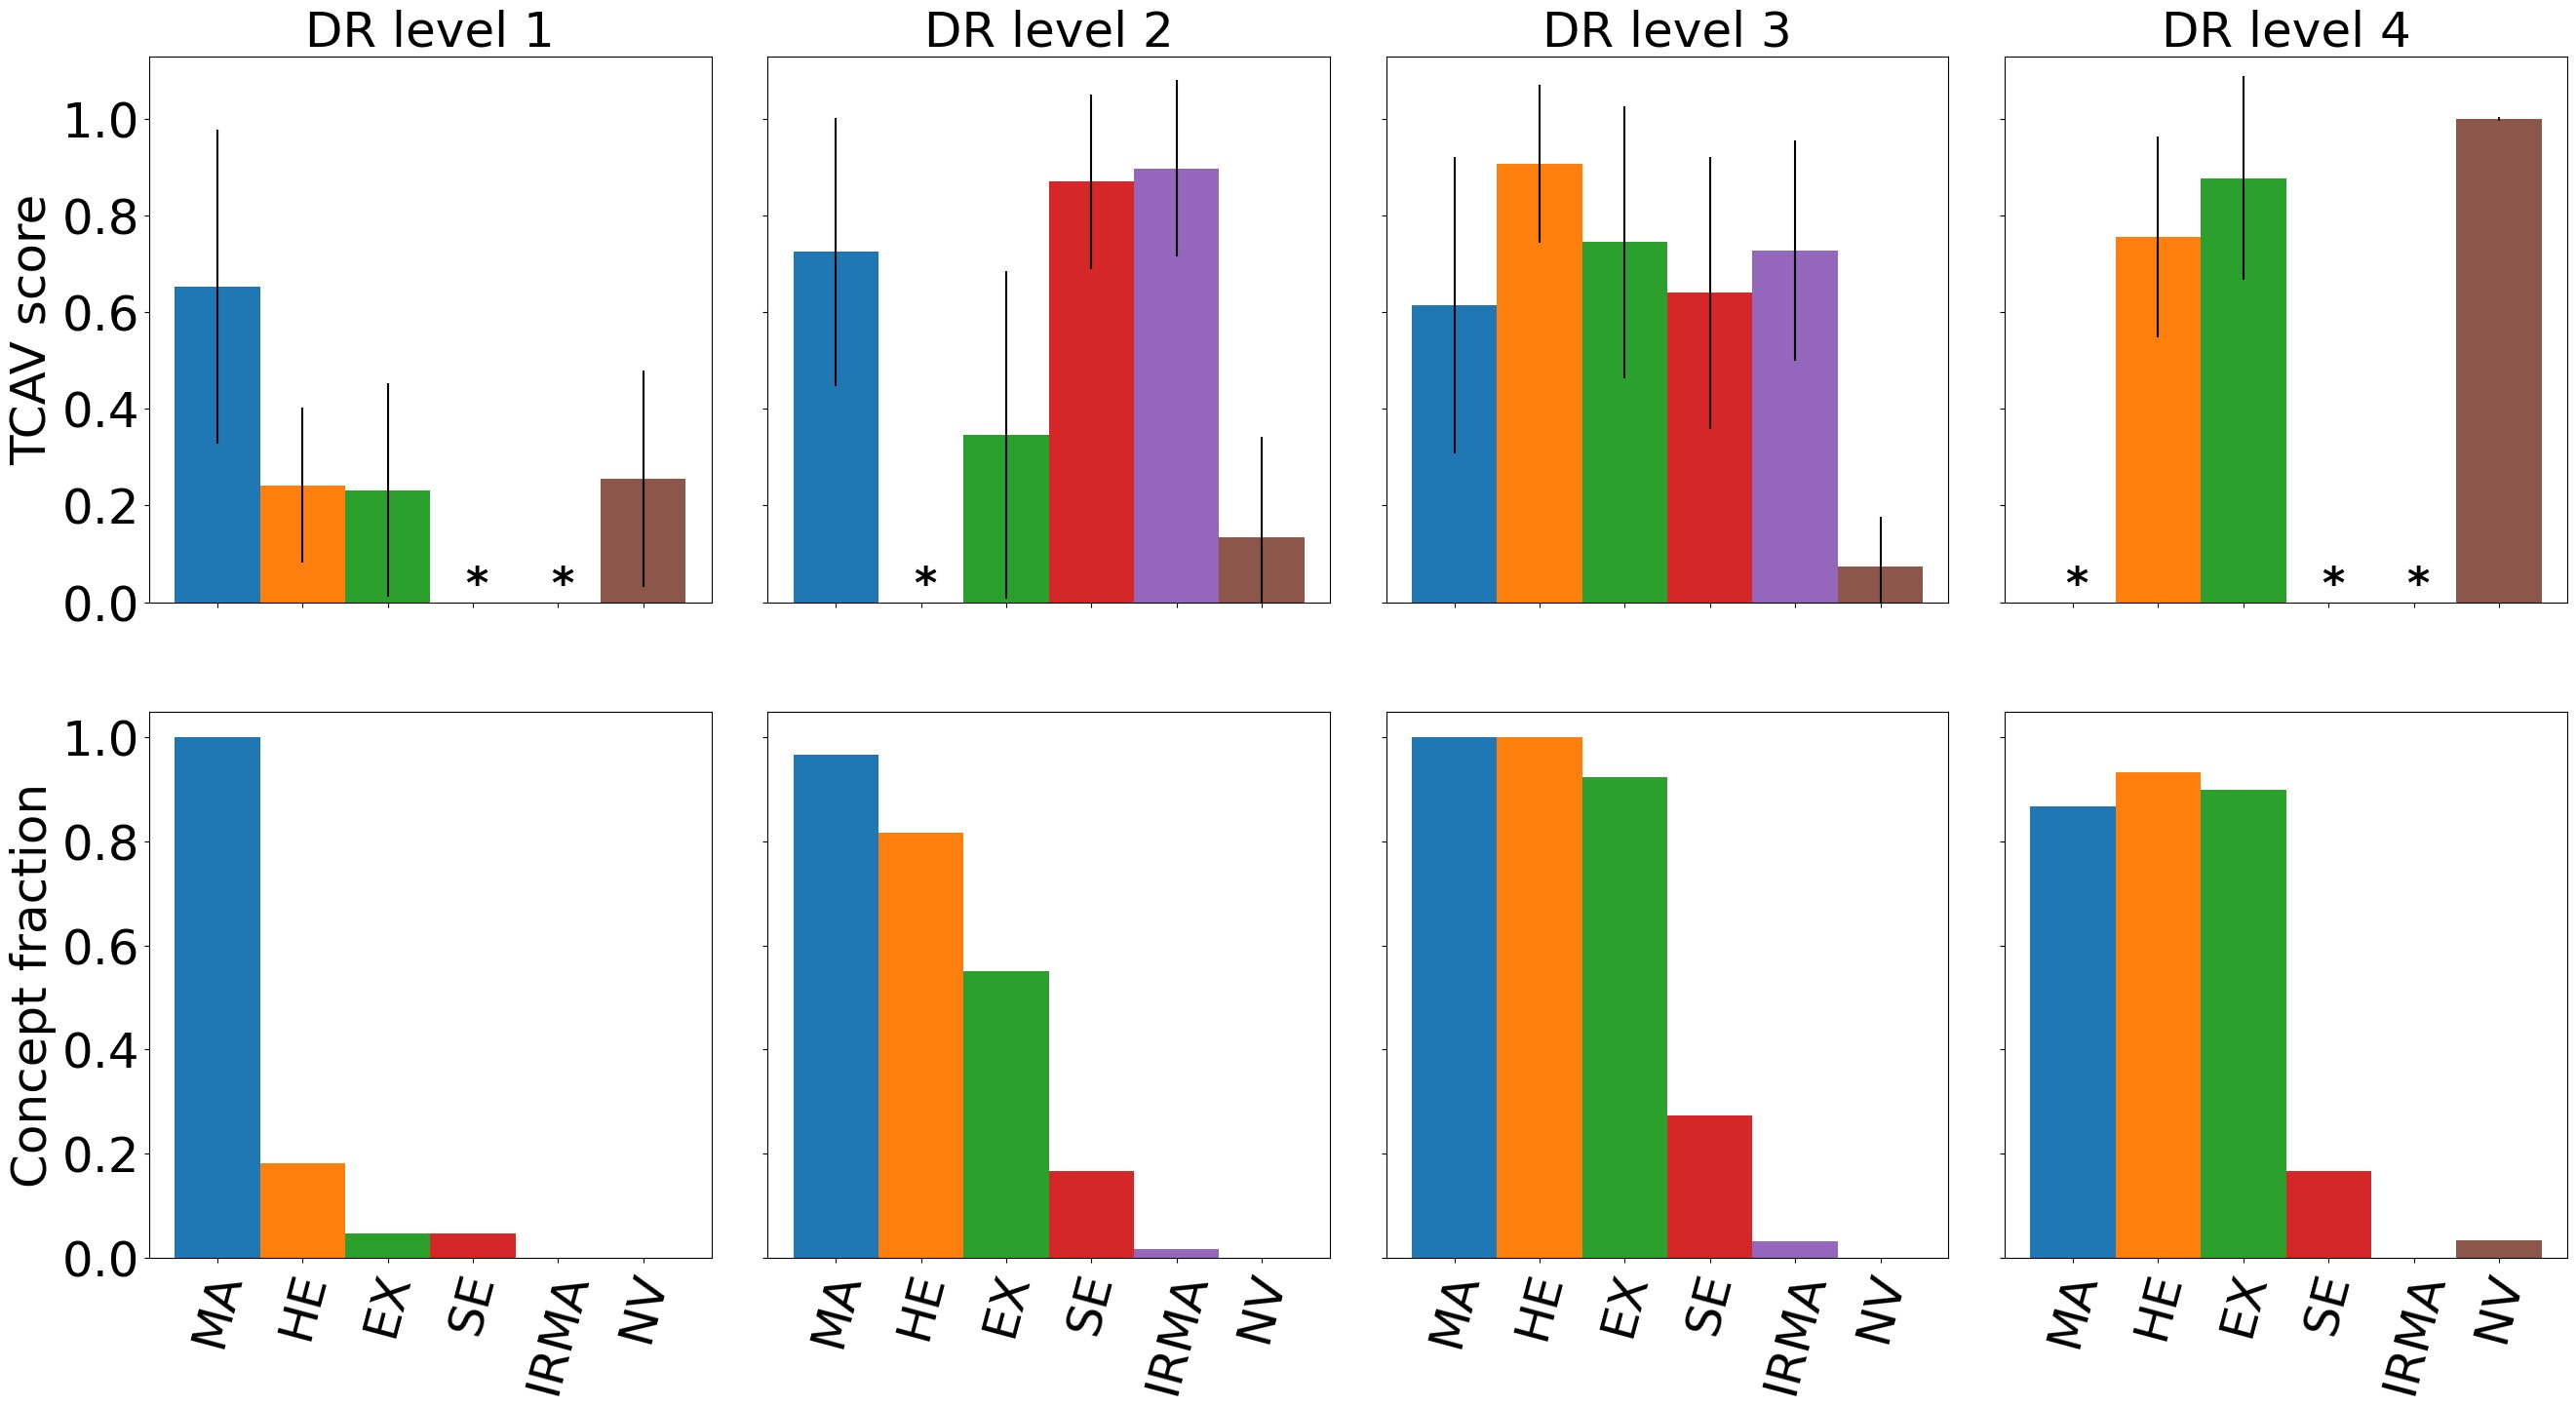
Due to memory limitations, TCAV scores were calculated on a representative subset of the combined test set consisting of randomly picked images from each DR level. The performance for DR prediction on the representative test set did not differ significantly from the full test set. As mentioned in Section 2.1, the TCAV concepts were either based on the full images or only the image area surrounding the medical finding(s) of interest. Masking the concept images did not generate significantly different results, thus the full concept images were used. Figure 3 shows both TCAV scores for each concept and the concept predictions with the CBM at different DR levels. Increasing DR severity is associated with higher TCAV scores for more concepts and higher concept counts. Note that the TCAV scores and CBM concept counts are not directly comparable. Different datasets were used, and the TCAV scores reflect relative importance between the concepts while the CBM counts are merely the predicted presence of concepts.
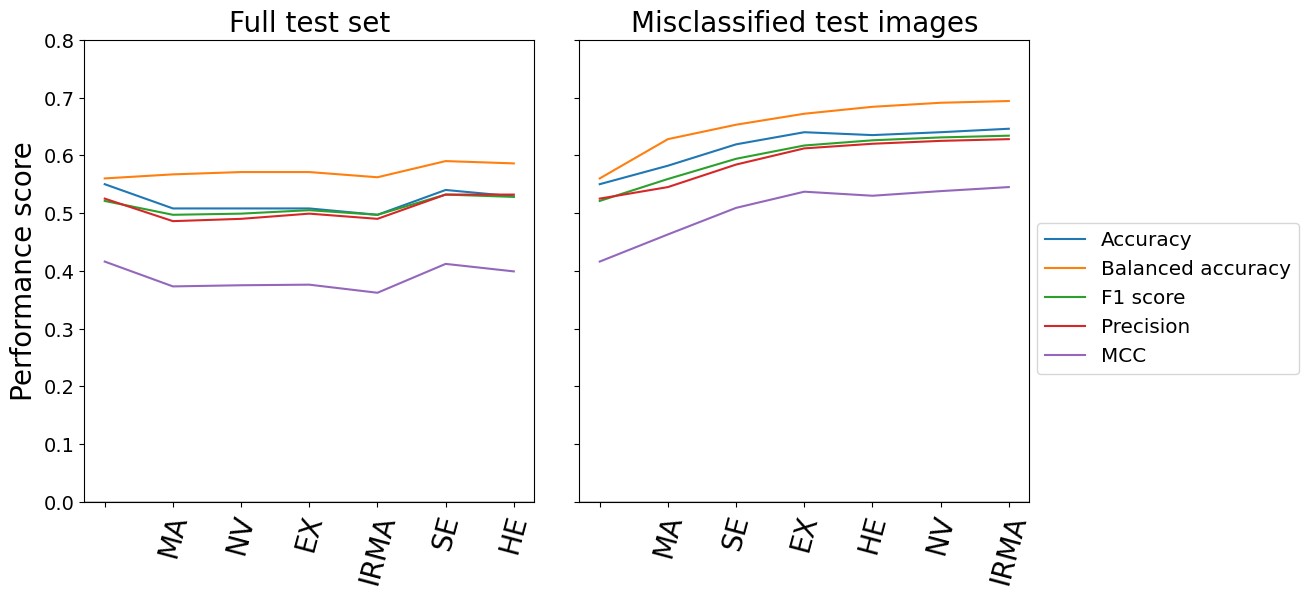
Test time intervention on an increasing number of concepts was performed for the CBM trained on six concepts. The intervention concerned concepts that were wrongly predicted by the CBM. As previously mentioned, the order of which concepts to intervene on was determined by the corresponding balanced accuracy in DR classification following the intervention on a single concept. Consequently, the concept resulting in the best balanced accuracy on the DR grading was included first, while the concept with the worst performance was included last. The left hand side of Figure 4 shows the DR classification performance metrics on the entire fine-grained annotations diabetic retinopathy (FGADR) test set when concept intervention was performed incrementally. We observe that the intervention had best effect when five out of six concepts were corrected (correcting the HE concept did not show further improvement). Even though the performance did not increase dramatically, test time intervention improved the balanced accuracy and precision compared to no intervention. Next, test time intervention was performed only on the misclassified images in the test set. As seen on the right hand side of Figure 4, the performance peaked when all six concepts were corrected. The balanced accuracy increased from 56.0% with no corrections to 69.4%. Qualitative examples on how test time intervention affected the DR level predictions are provided in Figure 5.
4 Discussion and Conclusion
According to the diagnostic criteria for DR level 1 (mild DR), MA should be the only abnormality present (Wilkinson et al., 2003). This corresponds well to both TCAV and CBM results in Figure 3, highlighting MA as the most important concept for DR level 1. The IRMA, SE, and MA concepts were ranked highest by TCAV for DR level 2, and all concepts but NV was identified by the CBM. This is consistent with the diagnostic criteria for MA, HE, and SE. Interestingly, the IRMA concept was ranked highest by TCAV, even though this finding is mainly associated with DR level 3. By inspecting the datasets more closely, several DR level 2 images actually contained IRMA. It is therefore reasonable that the model identifies IRMA as important when making predictions on DR level 2 images. Additionally, several DR level 3 images were predicted to belong to DR level 2. This can also partly be explained by the high TCAV scores for the IRMA concept. The TCAV scores for DR level 3 gave high importance to MA, HE, EX, SE, and IRMA, and are coherent with the diagnostic criteria for this DR level, as well as the presence of all concepts except NV for the CBM. The presence of HE, EX, and SE was increased compared to level 2, which is also expected. Finally, for DR level 4, TCAV ranked NV highest, followed by EX and HE, which was expected as this is the only DR level where NV is present. NV was also identified by the CBM. Taken together, the concept-based explanations seem to align with established medical knowledge about DR. This is encouraging in terms of applying TCAV and CBMs in the clinic for explaining deep neural networks for DR grading. The next step would be to validate the usability of these concept-based XAI methods with feedback from ophthalmologists. In this current study, we compare the explanations with widely accepted guidelines for grading of DR, but there might be other clinically relevant aspects that were not considered.
The overall ranking of the concepts were not different for the concepts based on full images and concepts based on masked images that focused on the area containing the medical findings of interest. This could mean that even though some findings are small, they are still sufficiently learnt from the full images. On the other hand, similar results could also indicate that the masking technique was not efficient enough. In order to avoid extreme deviations in the image sizes for the masked concept images, a lower limit of 520 520 pixels was applied. For images of low resolutions, this restriction implied that a very small part of the image was removed and that the masked and full image versions were almost the same. However, since the model was trained on images input size 620 620 pixels, input images with few pixels were regarded as less likely to provide useful results. Consequently, the lower pixel limit was considered the best alternative when preparing the masked concept images. The small variations between the results from full concept images and masked concept images indicate that it is sufficient to use the original images for concept generation. Further on, time is saved because we do not have to mask out the relevant findings from the images in order to get meaningful concepts.
IRMA and NV are typical findings for severe DR. The presence or absence of these findings is therefore expected as useful information when learning to grade DR. As observed in Table 2, the CBM trained on four concepts (MA, HE, EX and SE) performed worse when grading DR on the FGADR test set. Even though the model trained on four concepts received more training data and was better at predicting these four concepts than the model trained on all six concepts, missing information about IRMA and NV seems to negatively affect the DR grading. This highlights the importance of high quality concept annotations for these XAI methods.
Test time intervention showed to be a great advantage of the CBM and resulted in more accurate model predictions. When the concepts for incorrect predictions are inspected, the user can get important information about why an image was misclassified. As an example, the DR level image in Figure 5 was misclassified as DR level , because the bottleneck model missed the NV concept. By correcting this, the image was correctly classified.
Despite including images for training the combined DR classification model, the model did not outperform earlier deep neural networks (Lakshminarayanan et al., 2021). In this work, we combined four different datasets where the fundus images were captured using various devices and arriving from patient populations in different geographical areas. The high image diversity probably makes it challenging for a model to capture representative patterns in the data compared to more homogenous datasets. On the other hand, the diverse collection of training data could make the model robust to variations and noise in data from a real-world setting and increase its ability to generalize to new datasets. We could not identify any previous studies using the same combination of data as us, meaning that our results are not directly comparable to previously reported performance metrics. Because this study focuses on the explanation methods, the performance is regarded as sufficiently high.
Concept-based explanations are promising for increasing the understanding of DR grading with deep neural networks. While CBMs allow for test time intervention on the concepts, these models are limited by the lack of publicly available medical datasets annotated with both concepts and target labels. For TCAV, concepts can be defined using other data sources, meaning that the training data does not need additional concept annotations. Consequently, the model explained by TCAV outperformed the CBMs for DR grading. Our results highlight a major drawback of the CBMs: Because the development dataset must be annotated with concepts and DR level, the amount of available data is small. The requirement of training a modified CBM also complicates direct comparison and combination with other XAI methods. Before larger medical datasets annotated with concepts and target labels are available, TCAV gives the best trade-off between model performance and explainability for DR grading.
Acknowledgments
The research presented in this paper has benefited from the Experimental Infrastructure for Exploration of Exascale Computing (eX3), which is financially supported by the Research Council of Norway under contract 270053.
Ethical Standards
The work follows appropriate ethical standards in conducting research and writing the manuscript, following all applicable laws and regulations regarding treatment of animals or human subjects.
Conflicts of Interest
The authors declare no conflicts of interest.
Data availability
The datasets applied in the presented research are publicly available. Details regarding data and code are available on GitHub: https://github.com/AndreaStoraas/ConceptExplanations_DR_grading
References
- Abràmoff et al. (2013) Michael D. Abràmoff, James C. Folk, Dennis P. Han, Jonathan D. Walker, David F. Williams, Stephen R. Russell, Pascale Massin, Beatrice Cochener, Philippe Gain, Li Tang, Mathieu Lamard, Daniela C. Moga, Gwénolé Quellec, and Meindert Niemeijer. Automated Analysis of Retinal Images for Detection of Referable Diabetic Retinopathy. JAMA Ophthalmology, 131(3):351–357, 2013. ISSN 2168-6165. .
- Arun et al. (2021) Nishanth Arun, Nathan Gaw, Praveer Singh, Ken Chang, Mehak Aggarwal, Bryan Chen, Katharina Hoebel, Sharut Gupta, Jay Patel, Mishka Gidwani, Julius Adebayo, Matthew D. Li, and Jayashree Kalpathy-Cramer. Assessing the Trustworthiness of Saliency Maps for Localizing Abnormalities in Medical Imaging. Radiology: Artificial Intelligence, 3(6):e200267, 2021. .
- Ayhan et al. (2022) Murat Seçkin Ayhan, Louis Benedikt Kümmerle, Laura Kühlewein, Werner Inhoffen, Gulnar Aliyeva, Focke Ziemssen, and Philipp Berens. Clinical validation of saliency maps for understanding deep neural networks in ophthalmology. Medical Image Analysis, 77:102364, 2022. ISSN 1361-8415. .
- Chen et al. (2020) Zhi Chen, Yijie Bei, and Cynthia Rudin. Concept whitening for interpretable image recognition. Nature Machine Intelligence, 2:772–782, 2020. .
- Cuadros and Bresnick (2009) Jorge Cuadros and George Bresnick. EyePACS: an adaptable telemedicine system for diabetic retinopathy screening. Journal of Diabetes Science and Technology, 3(3):509–516, 2009.
- Decencière et al. (2014) Etienne Decencière, Xiwei Zhang, Guy Cazuguel, Bruno Lay, Béatrice Cochener, Caroline Trone, Philippe Gain, Richard Ordonez, Pascale Massin, Ali Erginay, Béatrice Charton, and Jean-Claude Klein. FEEDBACK ON A PUBLICLY DISTRIBUTED IMAGE DATABASE: THE MESSIDOR DATABASE. Image Analysis & Stereology, 33(3):231–234, 2014. ISSN 1854-5165. .
- Deng et al. (2009) J. Deng, W. Dong, R. Socher, L.-J. Li, K. Li, and L. Fei-Fei. ImageNet: A Large-Scale Hierarchical Image Database. In 2009 IEEE Conference on Computer Vision and Pattern Recognition, pages 248–255, 2009. .
- Dugas et al. (2015) Emma Dugas, Jorge Jared, and Will Cukierski. Diabetic Retinopathy Detection, 2015. URL https://kaggle.com/competitions/diabetic-retinopathy-detection.
- Huang et al. (2017) Gao Huang, Zhuang Liu, Laurens van der Maaten, and Kilian Q. Weinberger. Densely Connected Convolutional Networks. In Proceedings of the IEEE Conference on Computer Vision and Pattern Recognition (CVPR), pages 4700–4708, 2017.
- Karthik and Dane (2019) Maggie Karthik and Sohier Dane. APTOS 2019 Blindness Detection, 2019. URL https://kaggle.com/competitions/aptos2019-blindness-detection.
- Kauppi et al. (2007) T. Kauppi, V. Kalesnykiene, J.-K. Kamarainen, L. Lensu, I. Sorri, A. Raninen, R. Voutilainen, H. Uusitalo, H. Kalviainen, and J. Pietila. DIARETDB1 diabetic retinopathy database and evaluation protocol. In Proceedings of the British Machine Vision Conference, pages 15.1–15.10. BMVA Press, 2007. ISBN 1-901725-34-0. .
- Kim et al. (2018) Been Kim, Martin Wattenberg, Justin Gilmer, Carrie Cai, James Wexler, Fernanda Viegas, and Rory Sayres. Interpretability Beyond Feature Attribution: Quantitative Testing with Concept Activation Vectors (TCAV). In Jennifer Dy and Andreas Krause, editors, Proceedings of the 35th International Conference on Machine Learning, volume 80 of Proceedings of Machine Learning Research, pages 2668–2677. PMLR, 2018. URL https://proceedings.mlr.press/v80/kim18d.html.
- Koh et al. (2020) Pang Wei Koh, Thao Nguyen, Yew Siang Tang, Stephen Mussmann, Emma Pierson, Been Kim, and Percy Liang. Concept Bottleneck Models. In Hal Daumé III and Aarti Singh, editors, Proceedings of the 37th International Conference on Machine Learning, volume 119 of Proceedings of Machine Learning Research, pages 5338–5348. PMLR, 13–18 Jul 2020. URL https://proceedings.mlr.press/v119/koh20a.html.
- Kora et al. (2022) Padmavathi Kora, Chui Ping Ooi, Oliver Faust, U. Raghavendra, Anjan Gudigar, Wai Yee Chan, K. Meenakshi, K. Swaraja, Pawel Plawiak, and U. Rajendra Acharya. Transfer learning techniques for medical image analysis: A review. Biocybernetics and Biomedical Engineering, 42(1):79–107, 2022. ISSN 0208-5216. .
- Kovalerchuk et al. (2021) Boris Kovalerchuk, Muhammad Aurangzeb Ahmad, and Ankur Teredesai. Survey of Explainable Machine Learning with Visual and Granular Methods Beyond Quasi-Explanations, pages 217–267. Springer International Publishing, 2021. ISBN 978-3-030-64949-4. .
- Lakshminarayanan et al. (2021) Vasudevan Lakshminarayanan, Hoda Kheradfallah, Arya Sarkar, and Janarthanam Jothi Balaji. Automated Detection and Diagnosis of Diabetic Retinopathy: A Comprehensive Survey. Journal of Imaging, 7(9), 2021. ISSN 2313-433X. .
- Li et al. (2019) Tao Li, Yingqi Gao, Kai Wang, Song Guo, Hanruo Liu, and Hong Kang. Diagnostic assessment of deep learning algorithms for diabetic retinopathy screening. Information Sciences, 501:511–522, 2019. ISSN 0020-0255. .
- Paszke et al. (2019) Adam Paszke, Sam Gross, Francisco Massa, Adam Lerer, James Bradbury, Gregory Chanan, Trevor Killeen, Zeming Lin, Natalia Gimelshein, Luca Antiga, Alban Desmaison, Andreas Kopf, Edward Yang, Zachary DeVito, Martin Raison, Alykhan Tejani, Sasank Chilamkurthy, Benoit Steiner, Lu Fang, Junjie Bai, and Soumith Chintala. PyTorch: An Imperative Style, High-Performance Deep Learning Library. In H. Wallach, H. Larochelle, A. Beygelzimer, F. d'Alché-Buc, E. Fox, and R. Garnett, editors, Advances in Neural Information Processing Systems. Curran Associates, Inc., 2019. URL https://proceedings.neurips.cc/paper/2019/file/bdbca288fee7f92f2bfa9f7012727740-Paper.pdf.
- Porwal et al. (2018) Prasanna Porwal, Samiksha Pachade, Ravi Kamble, Manesh Kokare, Girish Deshmukh, Vivek Sahasrabuddhe, and Fabrice Meriaudeau. Indian Diabetic Retinopathy Image Dataset (IDRiD), 2018.
- Salahuddin et al. (2022) Zohaib Salahuddin, Henry C. Woodruff, Avishek Chatterjee, and Philippe Lambin. Transparency of deep neural networks for medical image analysis: A review of interpretability methods. Computers in Biology and Medicine, 140:105111, 2022. ISSN 0010-4825. .
- Szegedy et al. (2016) Christian Szegedy, Vincent Vanhoucke, Sergey Ioffe, Jon Shlens, and Zbigniew Wojna. Rethinking the Inception Architecture for Computer Vision. In Proceedings of the IEEE Conference on Computer Vision and Pattern Recognition (CVPR), pages 2818–2826, 2016. .
- Tsangalidou et al. (2022) Zoi Tsangalidou, Edwin Fong, Josefine Vilsbøll Sundgaard, Trine Julie Abrahamsen, and Kajsa Kvist. Multimodal deep transfer learning for the analysis of optical coherence tomography scans and retinal fundus photographs. In NeurIPS 2022 Workshop on Learning Meaningful Representations of Life, 2022. URL https://openreview.net/forum?id=dIo3v4Vwh73.
- van der Velden et al. (2022) Bas H.M. van der Velden, Hugo J. Kuijf, Kenneth G.A. Gilhuijs, and Max A. Viergever. Explainable artificial intelligence (XAI) in deep learning-based medical image analysis. Medical Image Analysis, 79:102470, 2022. ISSN 1361-8415. .
- Vellido (2020) Alfredo Vellido. The importance of interpretability and visualization in machine learning for applications in medicine and health care. Neural computing and applications, 32(24):18069–18083, 2020. .
- Wilkinson et al. (2003) C.P Wilkinson, Frederick L Ferris, Ronald E Klein, Paul P Lee, Carl David Agardh, Matthew Davis, Diana Dills, Anselm Kampik, R Pararajasegaram, and Juan T Verdaguer. Proposed international clinical diabetic retinopathy and diabetic macular edema disease severity scales. Ophthalmology, 110(9):1677–1682, 2003. ISSN 0161-6420. .
- World Health Organization (2022) World Health Organization. Diabetes. https://www.who.int/news-room/fact-sheets/detail/diabetes, 9 2022.
- Zhou et al. (2021) Y. Zhou, B. Wang, L. Huang, S. Cui, and L. Shao. A Benchmark for Studying Diabetic Retinopathy: Segmentation, Grading, and Transferability. IEEE Transactions on Medical Imaging, 40(3):818–828, 2021. .
- Zuiderveld (1994) Karel Zuiderveld. Contrast limited adaptive histogram equalization. Graphics gems, pages 474–485, 1994.